Dove tutto si connette
Sei pattern, sei articoli, un unico sistema di errori di pensiero. L'ultimo capitolo non è una conclusione — è l'unica parte che conta davvero.
Tocca il traffico, e cambia la qualità dell'aria. Migliora la qualità dell'aria, e migliori la salute pubblica. Ridisegna le strade, e abiliti l'integrazione. Tutto connesso a tutto il resto.
Questo è l'ultimo articolo della serie, e riguarda la cosa che connette i precedenti cinque.
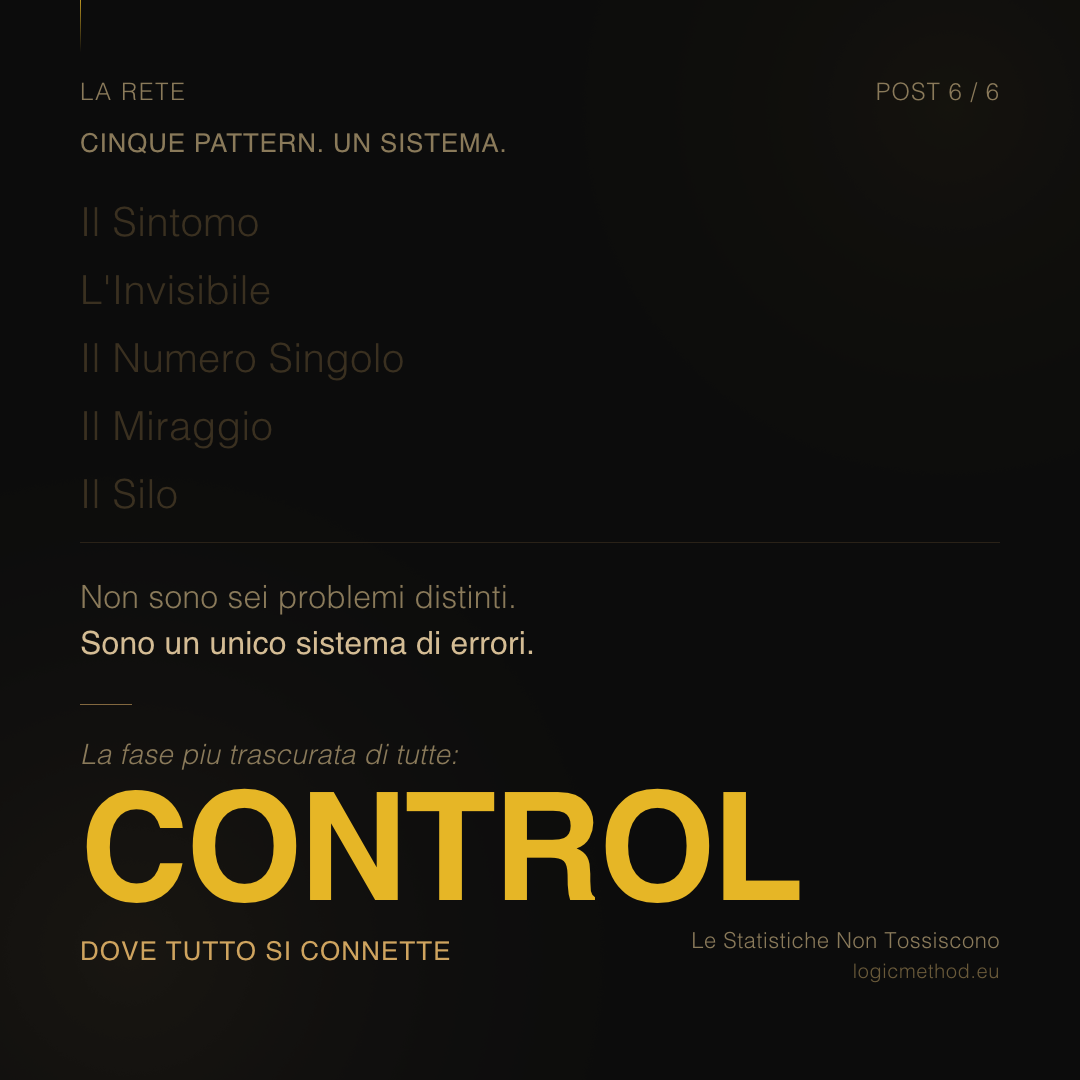
Ogni articolo ha descritto un pattern — un modo specifico in cui persone intelligenti e in buona fede sbagliano i problemi complessi. Trattare i sintomi invece delle cause. Contare ciò che è visibile invece di ciò che conta. Fidarsi delle metriche singole. Rispondere al rischio percepito invece di quello misurato. Risolvere i problemi nei silos.
Questi pattern non sono indipendenti. Sono un sistema.
Quando gli ingegneri del traffico di una città aggiungono capacità stradale, trattano il sintomo. Quando la qualità dell'aria migliora appena dopo che il traffico scompare, è perché le fonti invisibili — riscaldamento, agricoltura, chimica atmosferica — non sono mai state conteggiate. Quando il tasso di riciclaggio sembra buono al 78,9% ma il recupero effettivo di materiale è ben più basso, il numero singolo sta nascondendo il sistema. Quando una commerciante chiude prima perché la strada sembra insicura in una città con un tasso di omicidi di 0,6 per 100.000, il Miraggio è al lavoro. E quando un'ingegnera che sa riparare un canale trascorre dodici anni tra cinque enti, il Silo è la causa radice.
Ogni pattern rinforza gli altri. Il bias verso il sintomo mantiene l'invisibile invisibile. Il numero singolo abilita il silo, dando a ogni ufficio una metrica da ottimizzare in isolamento. Il Miraggio distrae attenzione e risorse dai rischi strutturali verso quelli drammatici. Non sono sei problemi. Sono un unico sistema di errori di pensiero.
Il DMAIC è stato progettato per le linee di produzione. Ma la logica è universale. Definire il vero problema. Misurare ciò che conta. Analizzare la causa radice. Migliorare il sistema, non il sintomo. Controllare — farlo durare oltre la prossima elezione, il prossimo ciclo di bilancio, la prossima amministrazione.
Quest'ultima fase — Control — è forse la più trascurata di tutte. Le misure d'emergenza di Pechino durante le Olimpiadi del 2008 hanno ridotto il PM2.5 del 30%. Gli effetti sono scomparsi entro un anno. Lo schema pari-dispari di Delhi ha ridotto il PM2.5 del 10–13%. Abbandonato dopo due tornate — nessuna infrastruttura istituzionale per sostenerlo. Il programma Hoy No Circula di Città del Messico, introdotto nel 1989, ha spinto i residenti ad acquistare una seconda auto per aggirare le restrizioni. Il programma è rimasto in vigore trentacinque anni dopo, senza ottenere nulla, se non dimostrare che una politica senza gestione adattiva diventa un monumento al proprio fallimento.
La popolazione italiana in età lavorativa è proiettata in calo di 7,7 milioni entro il 2050 secondo l'ISTAT — il che significa che ogni sistema costruito oggi deve essere progettato per sopravvivere alla trasformazione demografica, non solo al ciclo politico attuale.
Il pattern del dimenticare segue lo stesso arco ovunque. Anno 1: la crisi viene identificata, il budget stanziato, ottimismo. Anno 3: i risultati sono visibili, premi, il team inizia a pensare al prossimo problema. Anno 5: la crisi svanisce dalla memoria pubblica, pressione di bilancio per nuove priorità, la persona che ha scritto il piano originale si trasferisce in un altro ufficio. Anno 8: arriva una nuova amministrazione; il miglioramento è invisibile perché ha avuto successo — l'aria pulita non fa notizia, solo quella sporca. Anno 10: il problema ritorna. Viene scritto un nuovo piano. Diagnostica correttamente il problema. L'archivio si apre, e il nuovo piano scivola dentro, accanto ai vecchi.
Il metodo funziona. Le prove ci sono. Ciò che di solito manca è la disciplina di applicare tutte e cinque le fasi, nell'ordine giusto, senza saltare quelle scomode — e l'architettura per garantire che ciò che funziona oggi funzioni ancora quando nessuno ricorda più perché era stato costruito.
Ho scritto un libro su questo. Usa una città — Modena — come campo d'indagine, e un corgi dallo spazio come narratore. Ogni personaggio è inventato. Ogni numero è reale. Si chiama Le Statistiche Non Tossiscono: Sei problemi, una città, un corgi.
La cosa più economica che una città possa fare è dimenticare. Ecco perché l'ultimo capitolo non è una conclusione. È l'unica parte che conta davvero.
Ultimo di sei articoli sui pattern alla base di Le Statistiche Non Tossiscono: Sei problemi, una città, un corgi — un libro su come persone intelligenti sbagliano i problemi complessi, e come appare il pensiero strutturato quando funziona. Il libro è disponibile su Amazon.
La stessa radice, cinque volte
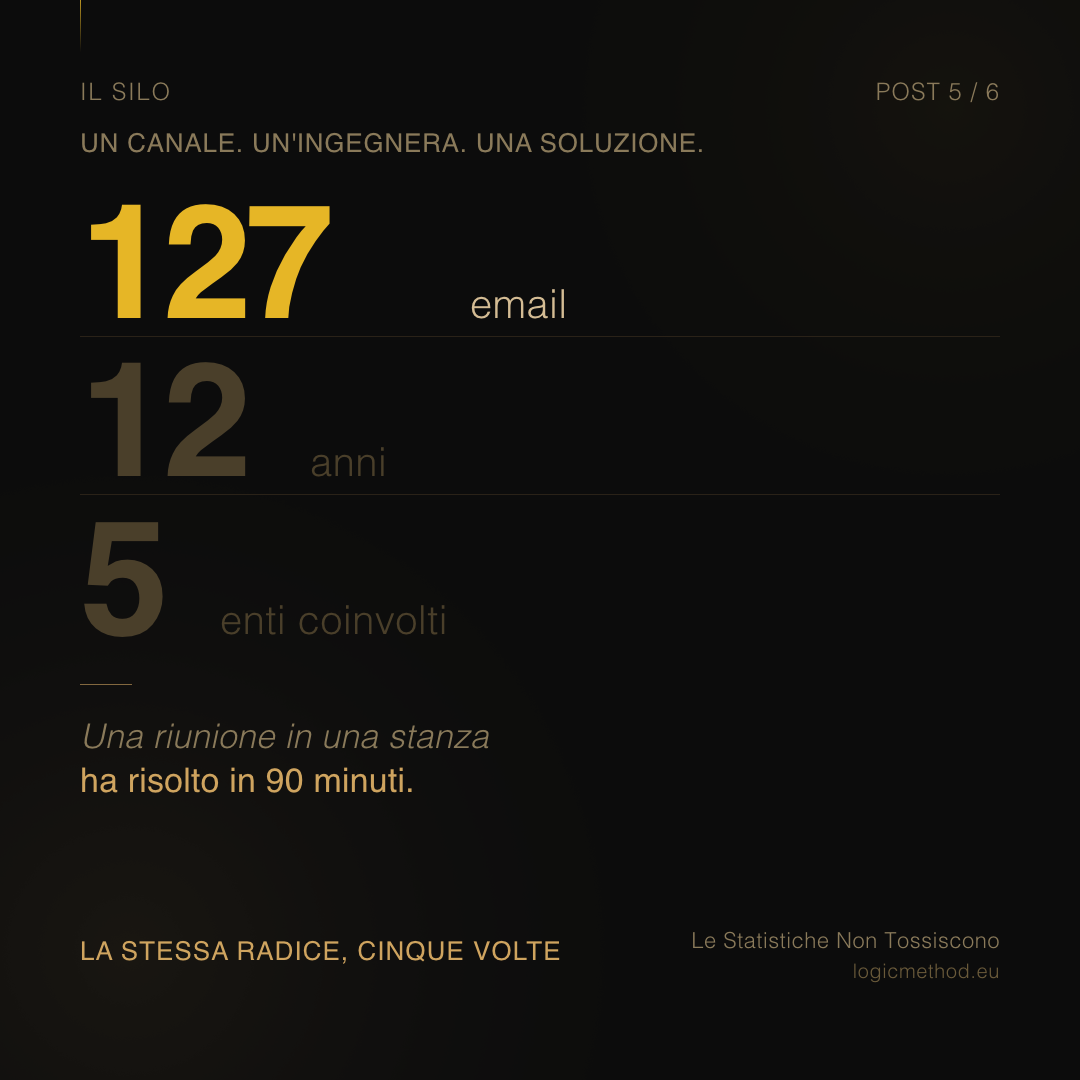
Un'ingegnera poteva disegnare la soluzione in un'ora. Ha trascorso dodici anni e 127 email cercando di farla approvare da cinque enti. Il canale ha esondato altre tre volte mentre le email si accumulavano.
Quando ogni analisi della causa radice termina nello stesso punto, si sta guardando o un artefatto metodologico o una verità strutturale. A Modena, era una verità strutturale.
La terza fase del DMAIC — Analyse — usa strumenti come il diagramma a lisca di pesce per risalire dal problema alla sua causa radice. Si parte dall'effetto visibile e si chiede "perché" finché non si raggiunge l'origine strutturale.
A Modena, in cinque domini problematici distinti — qualità dell'aria, traffico, rifiuti, casa e sicurezza pubblica — ogni analisi a lisca di pesce ha terminato nello stesso posto: nessuna istituzione aveva il mandato di ottimizzare il sistema nel suo insieme. Ogni ufficio ottimizzava il proprio pezzo. I pezzi non si sommavano. Negli spazi tra di loro vivevano i danni.
Il sistema del traffico era frammentato tra quattro uffici. Quello sanitario attraverso confini costituzionali. Il sistema dei rifiuti tra operatore e regolatore. Quello della sicurezza diviso tra tre forze di polizia senza analisi integrata. Il sistema idraulico richiedeva cinque enti per approvare la riprogettazione di un canale — un'ingegnera che poteva disegnare la soluzione in un'ora aveva trascorso dodici anni e 127 email nel tentativo di farla realizzare.
È un dato su Modena, o è una caratteristica del metodo analitico? Se si usa uno strumento progettato per trovare cause radice, forse le trova sempre — e forse "frammentazione della governance" è solo un posto convenientemente astratto dove smettere di scavare.
Quindi si verifica. Se la frammentazione della governance è la vera causa radice, le città che l'hanno ridotta dovrebbero mostrare risultati misurabili migliori.
Copenaghen ha consolidato ciclabilità, trasporto pubblico e pianificazione urbana in un'unica autorità per la mobilità. La sua quota modale dell'auto è scesa dal 33% al 25% in quindici anni, mentre quella di Modena è rimasta al 63%. Vienna ha integrato casa, attivazione delle unità vuote e infrastruttura sociale in un'unica entità. Il suo tasso di sfitto è sotto il 2%. Lubiana ha unificato raccolta dei rifiuti, trattamento ed economia circolare in un'unica azienda municipale. È passata dall'80% di smaltimento in discarica a meno del 5% in un decennio.
La convergenza non è un artefatto metodologico. È una regolarità empirica — la stessa che teorici dei sistemi da Donella Meadows a Elinor Ostrom hanno identificato: quando i problemi complessi attraversano più giurisdizioni istituzionali, la frammentazione non è incidentale al fallimento. È il fallimento.
Ma un'analisi onesta richiede un passo ulteriore. Il metodo dice cosa è rotto e come ripararlo. Non dice chi trae vantaggio dalla rottura. Quel canale non è rimasto non riparato per dodici anni perché nessuno capiva l'idraulica. È rimasto non riparato perché l'architettura istituzionale distribuiva la responsabilità così finemente che nessun attore sopportava il costo dell'inazione — e perché i costi delle alluvioni ricadevano su un inquilino straniero in un appartamento al piano terra che non vota alle elezioni comunali, mentre i costi della riparazione ricadevano su bilanci controllati da persone che non hanno mai visto la sua cucina dopo la pioggia.
L'ingegnera lo ha detto chiaramente: "Il diagramma a lisca di pesce vi dirà che la causa radice è la frammentazione della governance. Lo è. Ma la governance rimane frammentata perché la frammentazione protegge le persone che non pagano il prezzo."
Una riunione in una stanza ha risolto ciò che 127 email non riuscivano a risolvere: una diagnosi condivisa, una tabella di marcia comune, un accordo provvisorio di finanziamento — in novanta minuti. Il metodo funziona. Ma la quinta disciplina è questa: seguire la causa radice anche quando porta in un posto scomodo. La disfunzione più profonda di un sistema è raramente tecnica. È la domanda su chi sopporta il costo e chi controlla la riparazione — e cosa succede quando non sono le stesse persone.
Quinto di sei articoli sui pattern alla base di Le Statistiche Non Tossiscono: Sei problemi, una città, un corgi — un libro su come persone intelligenti sbagliano i problemi complessi, e come appare il pensiero strutturato quando funziona. Il libro è disponibile su Amazon.
La paura costa più del crimine
A Modena il tasso di omicidi è più basso che in Finlandia. Il tasso di paura non lo è. Perché il divario tra percezione e dati ha un costo reale — e chi lo paga.
Nella provincia di Modena sono stati denunciati circa 30.000 reati nel 2023, secondo i dati del Ministero dell'Interno pubblicati da Il Sole 24 Ore. Il tasso di omicidi è di 0,6 per 100.000 — più basso della Finlandia (1,6), del Belgio (1,7) e della Francia (1,3). Il 71% di tutti i reati denunciati non ha comportato alcun contatto fisico. Per qualsiasi misura statistica, Modena è una città sicura.
Per qualsiasi misura percettiva, non lo sembra. Solo il 57% dei residenti provinciali si sentiva sicuro camminando da solo dopo il buio, secondo i dati ISTAT sul benessere. Una quota significativa credeva che la criminalità grave fosse aumentata, quando in realtà era diminuita.
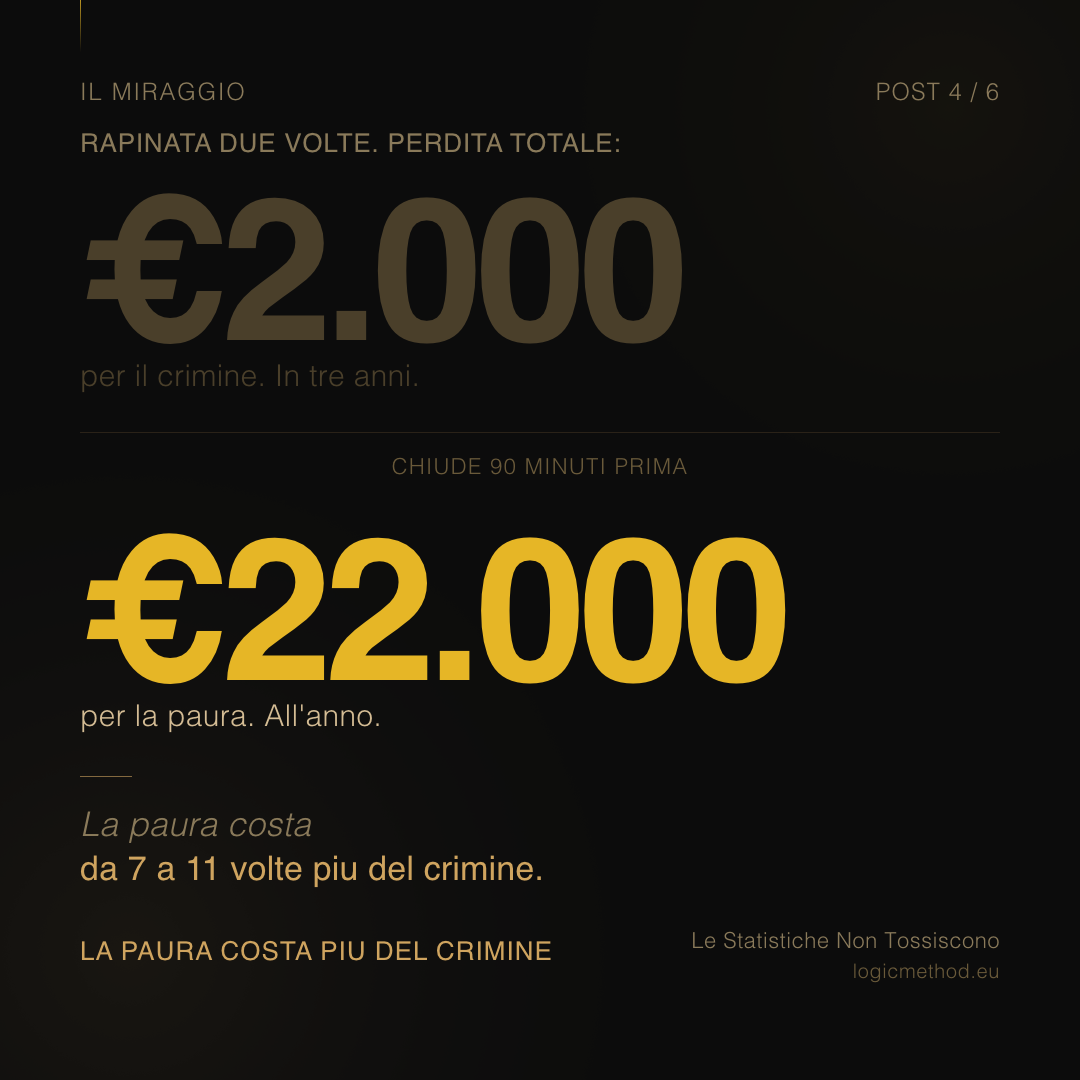
Questo divario tra percezione e misurazione ha un costo, e il costo non è astratto. Si consideri una commerciante rapinata due volte in tre anni — perdite totali di circa 2.000 euro. Inizia a chiudere novanta minuti prima perché la strada sembra insicura dopo il buio. A 35–50 euro l'ora di fatturato medio, per circa 300 giorni lavorativi all'anno, la chiusura anticipata le costa 15.000–22.000 euro all'anno. La paura costa da sette a undici volte più del crimine.
Non è irrazionalità. La strada è scarsamente illuminata — progettata per i veicoli, non per i pedoni. Ci sono meno persone che camminano dopo le sette perché la zonizzazione urbanistica ha concentrato gli uffici invece del misto funzionale, e le strade si svuotano all'ora di chiusura. I segnali ambientali — il marciapiede vuoto, gli angoli bui, i negozi con la serranda abbassata — producono una sensazione di pericolo che le statistiche sui reati non supportano. E ogni negozio che chiude prima rende la strada più vuota, il che la fa sembrare meno sicura, il che spinge il negozio successivo a chiudere prima. La paura si autoalimenta.
Nessuna istituzione è responsabile della sicurezza integrata del tragitto verso casa. Illuminazione: ufficio infrastrutture. Zonizzazione: urbanistica. Ordine pubblico: tre forze di polizia distinte senza analisi integrata. Attivazione commerciale: camera di commercio. Ciascuna fa la propria parte. Nessuna fa il tutto.
Il pattern si estende oltre il commercio. L'isolamento sociale — alimentato in parte dalla paura degli spazi pubblici — aumenta il rischio di mortalità del 26–32%, secondo la meta-analisi di Holt-Lunstad su Perspectives on Psychological Science. L'advisory del Surgeon General degli Stati Uniti del 2023 ha equiparato l'impatto sulla salute dell'isolamento cronico a quello di fumare quindici sigarette al giorno.
Nel frattempo, i rischi strutturali che nessuno teme: la violenza domestica nella provincia è stimata in 3.000–4.500 episodi reali contro i 450 denunciati. Per ogni donna che entra in una caserma, otto o nove non lo fanno. La criminalità organizzata genera un fatturato stimato di 20 miliardi di euro in Emilia-Romagna. Il pubblico teme lo scippo. Lo scippo costa centinaia. La mafia costa miliardi. La città organizza fiaccolate dopo il reato drammatico e non fa nulla dopo quello strutturale.
L'evoluzione ci ha preparato per la savana — un sistema di rilevamento delle minacce capace di percepire lo sguardo di un predatore a quaranta metri. Poi abbiamo costruito città dove le principali cause di danno sono il particolato atmosferico, la frammentazione istituzionale e l'isolamento. Nessuna delle quali provoca anche solo un battito cardiaco accelerato. Il Miraggio non è un difetto personale. È un disallineamento tra i rischi che la nostra biologia è stata costruita per rilevare e i rischi che i nostri sistemi producono davvero.
Quarto di sei articoli sui pattern alla base di Le Statistiche Non Tossiscono: Sei problemi, una città, un corgi — un libro su come persone intelligenti sbagliano i problemi complessi, e come appare il pensiero strutturato quando funziona. Il libro è disponibile su Amazon.
Il template DMAIC che non esisteva — ed è gratis
Decine di template DMAIC gratuiti esistono già. Sono tutti costruiti per una linea di produzione. Questo è costruito per i problemi che attraversano confini istituzionali — con un esempio completamente compilato su Modena.
In un workbook DMAIC, la differenza non la fanno gli strumenti — la fanno le domande che il workbook pone mentre li usi.
E quasi nessuno le pone.
Ci sono decine di template DMAIC gratuiti in rete. Sono costruiti tutti per lo stesso contesto standard: una linea di produzione, un processo con un unico responsabile, un difetto che si misura in pezzi per milione. Lisca di pesce con sei rami vuoti. Tabella SIPOC senza spiegare perché la SIPOC esiste. Cancelli di fase che chiedono se hai firmato un documento — senza chiederti se stai risolvendo il problema giusto.
Strumenti generici per problemi generici. Utili, se il tuo problema appartiene a un unico processo controllato da un unico team.
La maggior parte dei problemi difficili no.
Due file. Gratis. Senza registrazione.
La versione vuota. Un workbook DMAIC operativo costruito per i problemi che non appartengono a nessuno — o meglio, che appartengono a troppi: quelli che attraversano confini istituzionali, dove ogni dipartimento ottimizza la propria parte e il sistema non produce mai un risultato coerente. Sei schede. Ogni strumento spiegato nel suo scopo, non solo nominato. Ogni cancello di fase da attraversare prima di avanzare al successivo.
L'esempio compilato. La stessa template, interamente riempita — applicata a Modena, 185.000 abitanti, PM2,5 a 23,7 µg/m³, 4,7 volte la soglia che l'Organizzazione Mondiale della Sanità considera sicura, oltre cento morti premature ogni anno. Tre settori emissivi, tre istituzioni, zero meccanismo di coordinamento. Il caso su cui è costruito Le Statistiche Non Tossiscono.
L'esempio serve per vedere il metodo in funzione su qualcosa di reale. La versione vuota serve per applicare il metodo al proprio problema.
Gli strumenti nel workbook sono quelli standard: la definizione del problema in sette domande, la mappa del processo, l'analisi della causa radice, il Pareto, la valutazione dei rischi, il piano di controllo.
La differenza non è negli strumenti. È in quello che il workbook chiede mentre li usi.
In ogni cancello di fase c'è una domanda che la maggior parte dei template non pone mai. In Define: stai risolvendo la causa radice, o il sintomo che si vede meglio? In Analyse: stai rispondendo al rischio che hai misurato, o a quello che ti sembra urgente? In Control: il miglioramento che hai costruito sopravviverà a chi viene dopo di te?
Quest'ultima è la domanda che quasi nessuno si fa. Pechino ha tagliato l'inquinamento del 30% per le Olimpiadi del 2008 — gli effetti sono scomparsi in gran parte entro diciotto mesi. Delhi ha introdotto il blocco alternato per targa — abbandonato dopo due cicli, senza infrastruttura istituzionale per sostenerlo. Città del Messico ha vietato le auto un giorno alla settimana: i cittadini hanno comprato una seconda auto. Non erano fallimenti di politica. Erano fallimenti di architettura: soluzioni costruite senza preoccuparsi di quanto costasse smontarle.
Il workbook chiede, prima di chiudere la fase Control: il miglioramento sopravvivrà a tre elezioni, due tagli al budget e una recessione? Non è pessimismo. È aritmetica.
L'esempio di Modena non è un caso didattico semplificato.
Il PM2,5 annuale è 23,7 µg/m³ — legalmente conforme al limite UE di 25, e 4,7 volte la soglia OMS di 5. L'Italia registra 43.083 morti premature all'anno da esposizione a PM2,5 secondo l'Agenzia Europea dell'Ambiente: il dato più alto in Europa, più di tutti gli incidenti stradali, gli infortuni sul lavoro e gli omicidi sommati. Il PM10 scende di circa 0,4 µg/m³ all'anno — al ritmo attuale raggiungerà la soglia OMS di 15 µg/m³ intorno al 2082.
La causa radice non è il traffico. Nel lockdown il traffico è calato del 60–82%. Il PM10 è sceso di meno del 10%. Il problema è la frammentazione: riscaldamento (39% delle emissioni), traffico (34%) e agricoltura (24%) gestiti da tre istituzioni che non si sono mai trovate nella stessa stanza. La reazione chimica che produce la maggior parte del particolato invernale — nitrato di ammonio, nato dall'incontro tra ammoniaca agricola e ossidi di azoto del traffico — non chiede il permesso a nessuna giurisdizione. Attraversa tutte. Ogni istituzione ottimizza il proprio pezzo. I pezzi non si sommano. Il danno abita nello spazio tra di essi.
L'esempio documenta anche una cosa che molte analisi preferiscono tacere: un limite che non si rimuove. La geomorfologia della Pianura Padana — le inversioni termiche, il vento fermo a 0,8 metri al secondo — crea un soffitto fisico. Il PM2,5 non toccherà mai 5 µg/m³ con sole politiche locali, per quanto ben costruite. Il workbook lo registra come tale: una condizione al contorno, inevitabile, che sposta l'obiettivo da raggiungere il limite OMS ad avvicinarsi il più possibile — che è un obiettivo diverso, e più onesto.
Un'analisi che riconosce i propri limiti vale più di una che li nasconde. Quelle che li nascondono di solito hanno un altro nome: comunicati stampa.
La domanda sbagliata produce la risposta sbagliata, anche quando tutti gli strumenti sono usati correttamente. È per questo che la differenza non sta negli strumenti.
Parte della serie Le Statistiche Non Tossiscono: Sei problemi, una città, un corgi — un libro su come persone intelligenti sbagliano i problemi complessi, e come appare il pensiero strutturato quando funziona. Disponibile su Amazon.
Il numero che mente
Una donna paga 550 € di affitto in periferia. Aggiungi l'auto, il carburante, il tempo — il suo costo abitativo reale è 855 €. L'affitto era un numero. Il costo del sistema era invisibile.
Quando si guarda un numero singolo — l'affitto, la bolletta, il tasso di riciclaggio — si sta quasi certamente guardando il numero sbagliato.
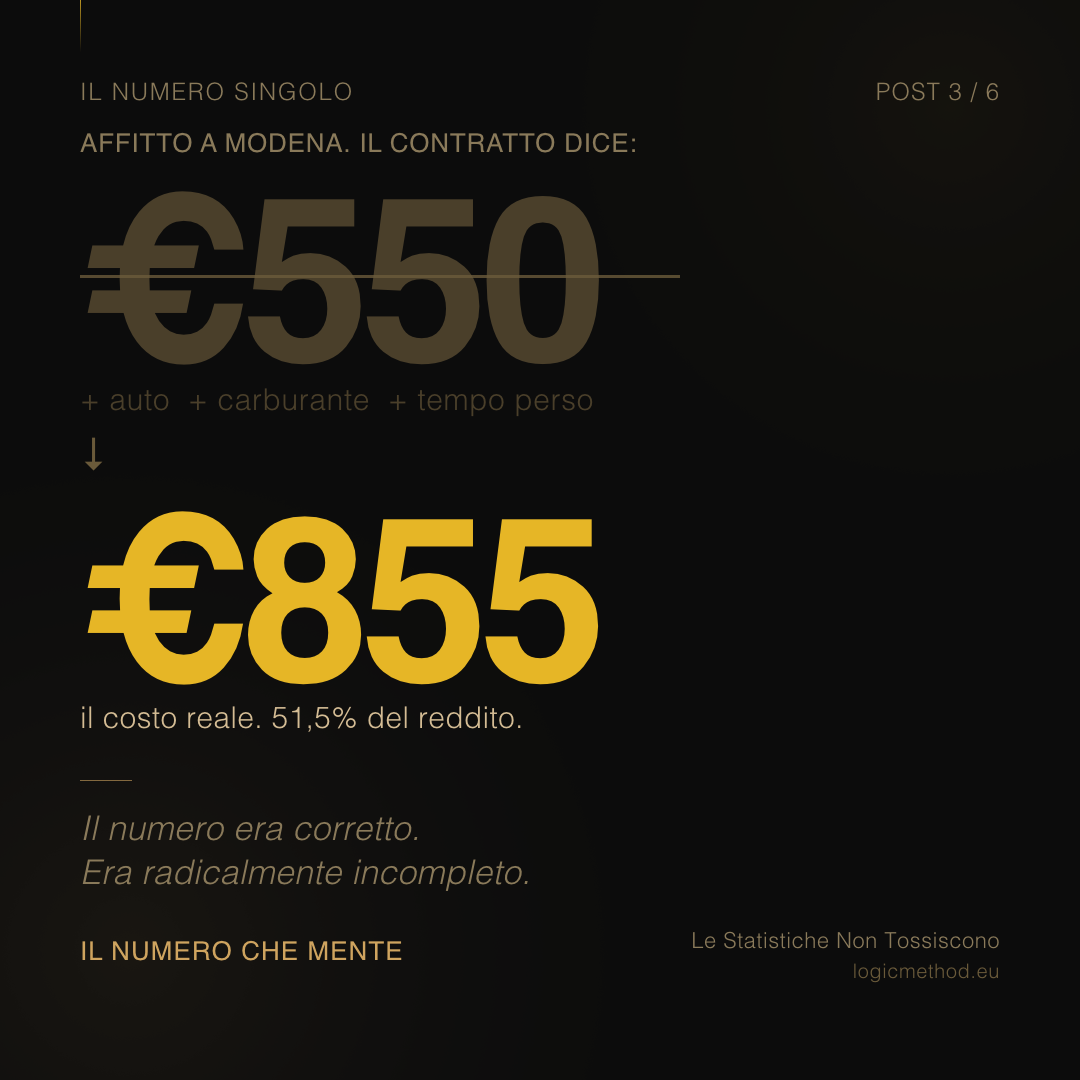
Una donna a Modena paga 550 euro al mese per un appartamento in periferia. Conveniente, rispetto al centro. Ma paga anche 175 euro per l'auto che le serve perché non c'è l'autobus, 80 euro di carburante, e l'equivalente di 50 euro in tempo perso nel pendolarismo. Il suo costo abitativo reale è 855 euro — il 51,5% del suo reddito lordo. L'affitto era il numero singolo. Il costo del sistema era invisibile.
Questo è un pattern. Funziona ovunque si usino metriche singole per valutare sistemi complessi.
Il tasso di riciclaggio di Modena è del 78,9%, secondo il rapporto ISPRA 2025. Un numero eccellente. Treviso, designata Capitale Verde Europea 2025, arriva all'87,2%. Ma il tasso di riciclaggio misura ciò che entra nel flusso di selezione, non ciò che ne esce. Il tasso di cattura della plastica mostra il 58%, ma il tasso effettivo di recupero materiale per le plastiche è di circa il 23%, una volta contabilizzate le perdite di selezione e le frazioni non riciclabili. Le analisi merceologiche dei rifiuti mostrano costantemente che il 70–85% di ciò che le persone mettono nel bidone dell'indifferenziato è materiale recuperabile che non raggiunge mai il flusso del riciclaggio.
La tassa sui rifiuti — TARI — è di circa 310 euro per famiglia all'anno. Non cambia in base a quanto rifiuto si produce. Chi separa tutto con cura paga lo stesso di chi butta tutto nell'indifferenziato. Il numero singolo — la tassa — nasconde interamente la struttura degli incentivi.
L'economia della gerarchia dei rifiuti è aritmetica semplice. Lo smaltimento in discarica costa 120 euro a tonnellata e non recupera nulla — distruggendo nel frattempo 85 euro di materiale recuperabile. Il riciclaggio costa 65 euro e recupera 85 — un profitto netto di 20 euro a tonnellata. La prevenzione costa 5–15 euro e risparmia 150 o più. La città spende di più su ciò che funziona meno, e meno su ciò che funziona di più. Ma questi costi ricadono su bilanci diversi, uffici diversi e anni diversi — così nessuno li somma mai.
Si consideri l'energia. Più del 50% degli edifici residenziali italiani è classificato nelle classi energetiche F o G, secondo l'ENEA. A Modena, il 72% degli edifici residenziali è stato costruito prima del 1976 — l'anno in cui l'Italia ha introdotto il primo standard di prestazione energetica. Un appartamento precedente al 1976 costa circa 180 euro al mese di riscaldamento. Riqualificato, costa 60. L'affitto è il numero singolo. La bolletta energetica è il costo nascosto che rende caro l'appartamento economico.
Si consideri l'offerta abitativa. Modena ha una carenza di circa 1.800 unità. Contemporaneamente, circa 5.000 appartamenti sono sfitti. Il numero singolo — il deficit di 1.800 unità — suggerisce che la città debba costruire. Il quadro completo suggerisce il contrario: un problema di attivazione delle unità vuote, non di costruzione. E incorporato in ogni nuovo edificio, un obbligo di parcheggio di 1,0–1,5 posti per unità aggiunge 15.000–25.000 euro al prezzo di ogni appartamento — un sussidio alla dipendenza dall'auto nascosto dentro il mercato immobiliare.
Il pattern del Numero Singolo funziona allo stesso modo con le persone. In Italia, due lavoratori non comunitari su tre sono impiegati al di sotto del proprio livello di qualificazione — un tasso di sovraistruzione del 66,5%, il divario più alto in Europa secondo Eurostat. Il titolo professionale è il numero singolo. Il sistema di riconoscimento delle qualifiche — quattro istituzioni, due-tre anni, 2.000–3.000 euro — è la struttura nascosta che lo produce. Un'infermiera formata nell'Africa subsahariana pulisce uffici in una città con migliaia di posti infermieristici vacanti, e il sistema che la tiene lì è invisibile a chiunque guardi solo le statistiche sull'occupazione.
Il DMAIC insiste nel misurare l'intero sistema, non la metrica conveniente. Un numero singolo di una situazione complessa è come una fotografia di un oggetto tridimensionale: accurata da un'angolazione, fuorviante su tutto il resto. Il numero non è sbagliato. È radicalmente incompleto. E le decisioni basate su numeri radicalmente incompleti producono risultati che sorprendono sistematicamente chi li ha presi — poi li sorprendono di nuovo, in modo identico, l'anno successivo.
Terzo di sei articoli sui pattern alla base di Le Statistiche Non Tossiscono: Sei problemi, una città, un corgi — un libro su come persone intelligenti sbagliano i problemi complessi, e come appare il pensiero strutturato quando funziona. Il libro è disponibile su Amazon.
Il problema che vediamo non è il problema
Articolo sulla struttura duale del mercato del lavoro italiano: dati su disoccupazione giovanile, contratti temporanei, produttività, e confronto con modelli Germania e Danimarca. Fa parte di una serie di sei articoli sul libro Le Statistiche Non Commutano.
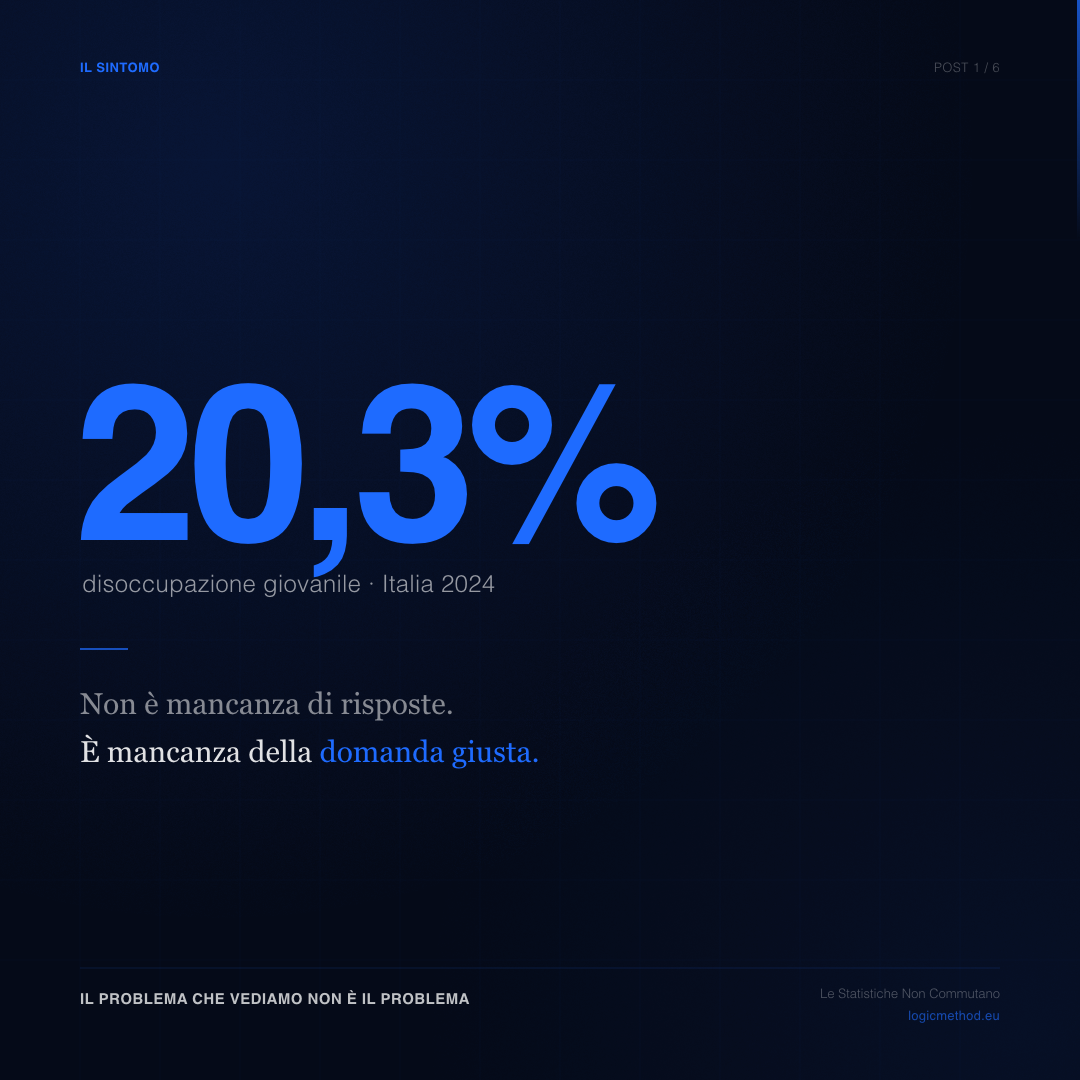
Dal 2003 a oggi, l'Italia ha varato riforme successive del mercato del lavoro. La Legge Biagi. Il Jobs Act. Miliardi stanziati, commissioni parlamentari, audizioni di esperti. Nel 2024, un giovane italiano su cinque non trovava lavoro — contro uno su dieci in Europa.
L'istinto è ovvio: più formazione, più incentivi alle assunzioni, più programmi per i giovani. È esattamente quello che è stato fatto. È esattamente quello che non ha funzionato.
Nella risoluzione dei problemi, la prima fase si chiama Define: prima di intervenire, stabilire qual è il vero problema. Non il sintomo visibile — il meccanismo che lo produce. La disoccupazione giovanile italiana sembra il problema. Non è il problema. È il modo in cui un sistema comunica che qualcos'altro è guasto.
Seguendo i dati invece della lamentela, il quadro è diverso da quello che appare sulla diapositiva.
Nel 2024, il 23,9% dei lavoratori italiani tra i 25 e i 34 anni lavorava ancora con un contratto temporaneo — contro il 16,7% della media europea. Non perché i giovani preferissero la flessibilità. Perché assumere a tempo indeterminato è strutturalmente sconveniente per le imprese più piccole: costi di uscita elevati, procedure consolidate, incertezza. Il contratto a sei mesi è più costoso dell'alternativa solo per chi lo subisce. Per chi lo offre, funziona.
Nel frattempo, il tasso di partecipazione dei 15–24enni al mercato del lavoro è sceso dal 38,1% del 2000 al 24,7% del 2024. Tre giovani su quattro non ci provano nemmeno — studiano, hanno smesso di cercare, o sono in quella zona grigia in cui tecnicamente non risultano disoccupati ma non lavorano. Tra le giovani donne: dal 34% al 19,4%. All'altro capo del sistema, il tasso di partecipazione dei lavoratori tra i 55 e i 64 anni è salito al 61,3%, venticinque punti percentuali in più rispetto al 2000 — effetto diretto delle riforme pensionistiche che hanno alzato l'età pensionabile. I posti non si liberavano. Il ricambio non avveniva.
Il ciclo è preciso: le imprese rispondono agli incentivi esistenti, non alle dichiarazioni di intento. Assumere un giovane a tempo indeterminato attiva un sistema di protezioni costruito decenni fa per un mercato che non esiste più. Il contratto a progetto risolve il problema dell'impresa. Produce il terzo, il quarto, il quinto anno consecutivo di vita sospesa per chi lo riceve — impossibilità di richiedere un mutuo, di pianificare una famiglia, di costruire contributi previdenziali coerenti. Il costo è reale. Non appare su nessuna diapositiva perché non viene misurato.
L'economia ne porta la traccia. La produttività oraria italiana è ferma dal 2000 — oscillata tra 52 e 55 dollari l'ora, corretti per il costo della vita. Nello stesso periodo, Germania e Francia l'hanno aumentata di oltre il 20%. I salari medi italiani nel 2023 erano più bassi di quelli del 2000. Un'economia che non cresce non produce posti di lavoro stabili. Non produce posti di lavoro stabili perché i giovani non riescono a costruire carriere. I giovani non riescono a costruire carriere perché l'economia non cresce. Il ciclo ha quarant'anni.
La questione non è se le riforme erano mal progettate. È che nessuna aveva posto la domanda fondamentale: chi beneficia dal mantenere il sistema così com'è? Chi aveva già un contratto stabile beneficiava. Le imprese grandi beneficiavano di un bacino flessibile a basso costo. I sindacati dei garantiti beneficiavano di una base da proteggere. I partiti con quella base elettorale beneficiavano di non toccarla. Il costo era distribuito su chi non aveva abbastanza voce per renderlo politicamente insostenibile.
La disoccupazione giovanile in Italia è scesa dal picco del 42,7% del 2014 all'attuale 20,3%. Il miglioramento è reale. Ma la struttura è intatta: un mercato del lavoro che protegge chi è già dentro e scarica la flessibilità su chi è ancora fuori, con incentivi politici che rendono quella distribuzione stabile. Curare il sintomo senza toccare la struttura non risolve il problema — lo sposta, lo rinomina, e permette di presentarlo come priorità nella prossima legislatura.
La Germania ha ridotto il dualismo costruendo un'architettura — formazione professionale integrata nelle imprese, transizioni brevi, protezione sul percorso invece che sulla posizione. Non un programma. Una struttura costruita in decenni. La Danimarca ha protetto il lavoratore nella transizione tra contratti, non nel contratto. Entrambi i modelli condividono una caratteristica che nessuna diapositiva della commissione aveva mai contenuto: partivano dalla domanda giusta.
Il Sintomo è il nome del primo errore: la domanda sbagliata che sembra ovviamente giusta fino a quando smetti di guardarla.
Primo di sei articoli sui pattern alla base di Le Statistiche Non Commutano: sei problemi nazionali, un sistema, un corgi — un libro su come l'Italia misura bene ciò che vede e smette di guardare il resto. In uscita 2026.
I numeri che non contiamo
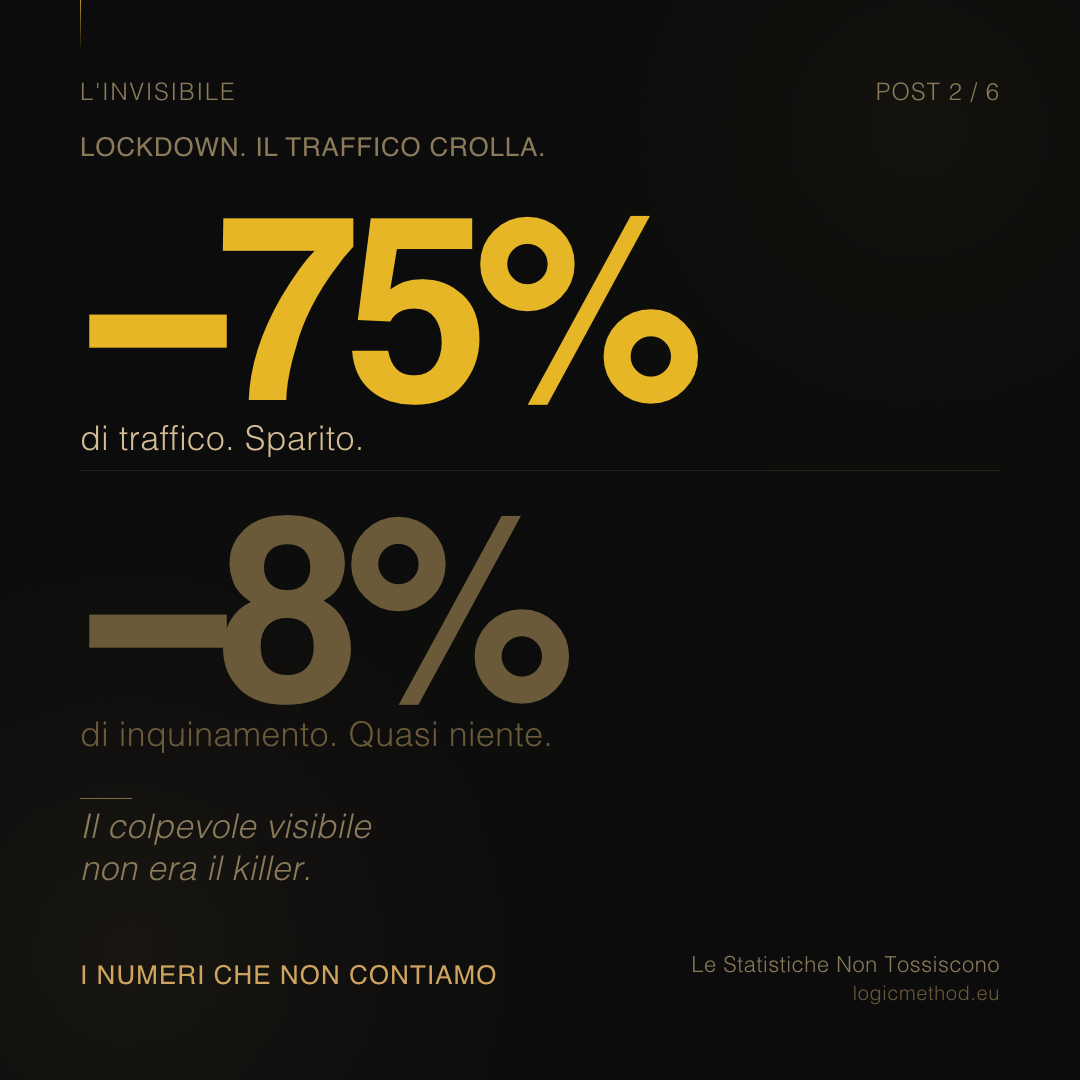
Durante il Covid, il traffico in Italia è calato del 75%. L'inquinamento atmosferico è sceso meno del 10%. Il colpevole visibile non era il killer — e 43.000 persone muoiono ogni anno per quello che lo è.
L'Italia ha il più alto numero di morti per inquinamento atmosferico in Europa. L'attenzione politica che riceve è vicina allo zero.
L'Agenzia Europea dell'Ambiente ha pubblicato i propri dati nel dicembre 2025: 43.083 morti premature in Italia attribuibili all'esposizione al PM2.5 in un solo anno. Il dato assoluto più alto tra tutti gli stati membri dell'UE.
Per dare un riferimento: è più di tutti i morti per incidenti stradali, infortuni sul lavoro e omicidi in Italia messi insieme — e di molto.
A Modena, la stazione di monitoraggio di Via Giardini registra un valore medio annuo di PM2.5 pari a 23,7 µg/m³. Il limite UE è 25. La soglia dell'OMS è 5. Modena è in regola con la legge ed è quasi cinque volte sopra la soglia di sicurezza raccomandata dalla principale autorità sanitaria mondiale.
Ecco cosa rende tutto questo invisibile. Il PM10 — la frazione di particolato più grossolana — è in calo: da 42,1 µg/m³ nel 2015 a 38,2 nel 2024. Progresso. A quel ritmo di 0,4 µg/m³ l'anno, Modena raggiungerà la soglia OMS di 15 µg/m³ nel 2082. Fra quasi sessant'anni.
Il costo non è ipotetico. Proporzionalmente, la quota di Modena nella mortalità nazionale per inquinamento atmosferico è ben oltre cento vite l'anno. Ma nessuna voce del bilancio comunale dice "inquinamento atmosferico". Il costo è distribuito tra posti letto d'ospedale, prescrizioni, giorni di malattia e pensionamenti anticipati — sepolto nella spesa sanitaria che nessuno ricollega all'aria fuori dalla finestra.
Il Covid ha fornito un esperimento accidentale. Durante il lockdown, il traffico in Italia è calato del 60–82% secondo i Google Mobility Reports e i dati autostradali ANAS. A Modena, il PM10 è sceso da 38,2 a circa 35,1 µg/m³ — meno del 10% di riduzione. Il traffico era quasi scomparso, e l'aria aveva appena cambiato.
Perché? Perché il traffico non è la fonte principale. Secondo gli inventari emissivi del progetto PREPAIR e gli studi di ripartizione delle sorgenti di ARPAE, il riscaldamento contribuisce per circa il 39% al particolato nella Pianura Padana, il traffico per il 34%, l'agricoltura per il 24%. Durante gli episodi invernali di inquinamento, la formazione secondaria — reazioni chimiche in atmosfera dove l'ammoniaca proveniente dall'allevamento si combina con gli ossidi di azoto — può contribuire al 50–70% della massa totale di PM.
La città discute di traffico perché il traffico è visibile. L'aria uccide in silenzio, distribuita su quattro settori di emissione e una chimica che nessuno ha votato. La seconda fase del DMAIC è Measure — e misurare significa contare ciò che conta, non ciò che è facile contare.
Se cento persone morissero nel crollo di un edificio, il paese si fermerebbe. Se cento persone morissero in un'alluvione, ci sarebbe un giorno di lutto. Se cento persone fossero uccise da un prodotto contaminato, il produttore sarebbe in prigione. Ma cento persone uccise dall'aria stessa — lentamente, invisibilmente, un polmone compromesso alla volta — non producono nulla. Nessuna emergenza. Nessuna inchiesta. Nessun memoriale. Solo il prossimo rapporto annuale, con un numero leggermente diverso e ugualmente ignorato.
I numeri esistono. ARPAE li raccoglie con il 96,3% di cattura dei dati. Il divario non è la conoscenza. È l'attenzione — e l'attenzione segue la visibilità, non la gravità. Questo è il pattern. Non è esclusivo della qualità dell'aria, e non è esclusivo di Modena. Funziona ovunque il problema più pericoloso sia quello che non si può vedere, annusare, o attribuire a un singolo colpevole.
Secondo di sei articoli sui pattern alla base di Le Statistiche Non Tossiscono: Sei problemi, una città, un corgi. Il libro è disponibile su Amazon.
Definire prima di risolvere
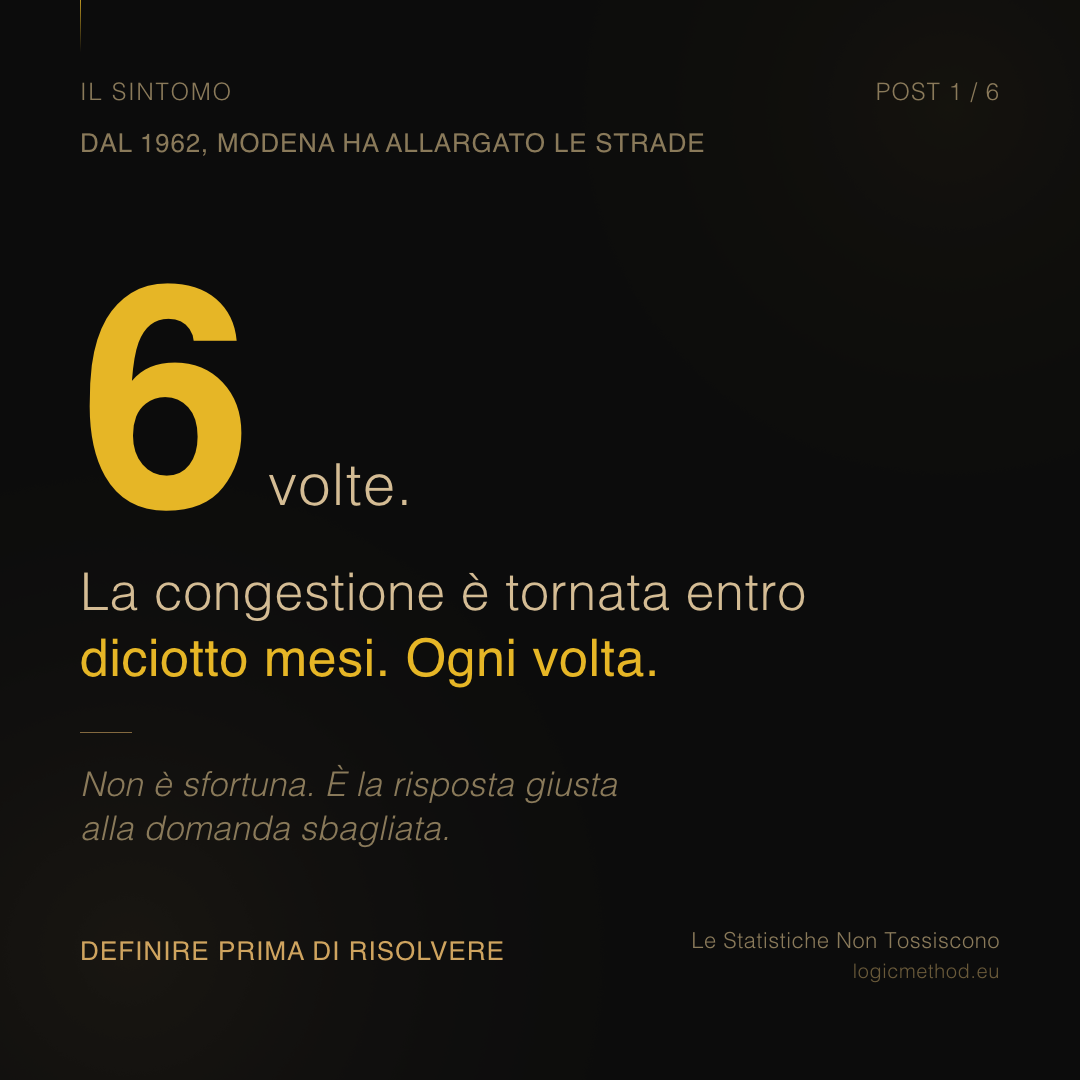
Modena ha 160.000 auto e 247 km di piste ciclabili. Una bicicletta completa un tragitto urbano tipico nel 36% meno tempo di un'auto. Allora perché continua ad allargare le strade?
L'errore più comune nella risoluzione dei problemi non è sbagliare la risposta. È rispondere alla domanda sbagliata.
Nella gestione della qualità esiste una metodologia chiamata DMAIC — Define, Measure, Analyse, Improve, Control. Nata nell'industria manifatturiera, dove ha eliminato i difetti dalle linee di produzione. La prima fase è Define: stabilire qual è il vero problema prima di intervenire.
Sembra ovvio. Non viene quasi mai fatto.
Modena — 185.000 abitanti, Pianura Padana — ha un problema di traffico sotto gli occhi di tutti. La quota modale dell'auto è al 63%, secondo il Piano Urbano della Mobilità Sostenibile della città. Ci sono 160.000 veicoli immatricolati — circa uno per abitante, neonati compresi. I pendolari trascorrono oltre 200 ore l'anno alla guida e circa 5.700 euro per il possesso dell'auto. Un ciclista in forma completa un tragitto urbano tipico nel 36% meno tempo di un'auto.
L'istinto è risolvere il traffico. Costruire una tangenziale. Allargare la strada. Aumentare la portata.
Ma gli economisti dei trasporti sanno dal 1962 che aggiungere capacità stradale genera nuova domanda. Anthony Downs descrisse il fenomeno sul Traffic Quarterly quell'anno. Duranton e Turner lo confermarono empiricamente sull'American Economic Review nel 2011: la nuova capacità autostradale si riempie entro uno-cinque anni. La soluzione riproduce il problema.
Succede quando si salta la fase Define. Si vede la congestione e si allarga la strada. Si vede il sintomo e lo si cura. Si risolve ciò che è visibile invece di ciò che è causale.
Seguendo i dati invece della lamentela, il costo reale non è il traffico in sé ma il sistema che lo produce. Modena ha 120.000 parcheggi. Il sussidio annuale implicito per quei parcheggi gratuiti è di circa 41,8 milioni di euro, calcolato con la metodologia di Donald Shoup in The High Cost of Free Parking. Ogni nuova unità abitativa è obbligata per legge a includere 1,0–1,5 posti auto, aggiungendo 15.000–25.000 euro al prezzo di ogni appartamento. La dipendenza dall'auto è costruita nella struttura fisica della città — poi ci si chiede perché il 63% degli spostamenti avviene in macchina.
Stoccolma ha capito. Quando ha introdotto il congestion pricing nel 2006, il traffico nell'area metropolitana è calato del 20–22%, secondo la ricerca di Jonas Eliasson su Transportation Research Part A. Le emissioni di CO₂ sono scese del 2–3%. Non perché abbiano costruito più strade — perché hanno ridefinito il problema: non capacità insufficiente, ma domanda sottoprezzata.
Nel frattempo, quasi un terzo dei residenti di Modena — 54.500 persone — non può guidare per età, disabilità, reddito o status giuridico. Dipendono interamente da un sistema progettato intorno a una modalità che non possono usare. Il passeggero dell'autobus resta fermo nello stesso traffico dell'auto, penalizzato per aver fatto la scelta socialmente ottimale. L'automobilista è premiato per aver fatto quella socialmente distruttiva. La struttura degli incentivi è esattamente rovesciata — e invisibile, perché la domanda era stata formulata come "come muoviamo i veicoli?" invece di "come muoviamo le persone?"
Dal 1962 Modena ha allargato le strade sei volte. Ogni volta, la congestione è tornata entro diciotto mesi. Sei ripetizioni dello stesso intervento che produce lo stesso fallimento non sono sfortuna. È un sistema che funziona esattamente come progettato — per l'obiettivo sbagliato.
La prima fase è quella più sistematicamente saltata. Non perché sia difficile — ma perché la domanda sbagliata sembra così ovviamente giusta che nessuno pensa di verificare se lo sia.
Primo di sei articoli sui pattern alla base di Le Statistiche Non Tossiscono: Sei problemi, una città, un corgi. Il libro è disponibile su Amazon.
Where It All Connects
Beijing's Olympic air measures vanished in a year. Delhi's odd-even scheme was abandoned. Mexico City's driving ban made people buy second cars. The hardest part of solving a problem isn't the solution — it's making it last.
Touch traffic, and you affect air quality. Improve air quality, and you improve public health. Redesign streets, and you enable integration. Everything connected to everything else.
This is the final article in this series, and it is about the thing that connects the previous five.
Each article described a pattern — a specific way that intelligent, well-intentioned people get complex problems wrong. Treating symptoms instead of causes. Counting what is visible instead of what matters. Trusting single metrics. Responding to perceived risk instead of measured risk. Solving problems in silos.
These patterns are not independent. They are a system.
When a city's traffic engineers add road capacity, they are treating the symptom. When the air quality barely improves after traffic disappears, it is because the invisible sources — heating, agriculture, atmospheric chemistry — were never counted. When the recycling rate looks good at 78.9% but the true material recovery is far lower, the single number is hiding the system. When a shop owner closes early because the street feels unsafe in a city with a homicide rate of 0.6 per 100,000, the mirage is operating. And when an engineer who can fix a canal spends twelve years navigating five institutions, the silo is the root cause.
Each pattern reinforces the others. The symptom bias makes the invisible stay invisible. The single number enables the silo by giving each department a metric to optimise in isolation. The mirage diverts attention and resources from the structural risks to the dramatic ones. They are not six problems. They are one system of thinking errors.
DMAIC was designed for production lines. But the logic is universal. Define the real problem. Measure what matters. Analyse the root cause. Improve the system, not the symptom. Control — make it last beyond the next election, the next budget cycle, the next administration.
That last phase — Control — might be the most neglected of all. Beijing's emergency measures during the 2008 Olympics dropped PM2.5 by 30%. The effects disappeared within a year. Delhi's odd-even vehicle scheme cut PM2.5 by 10–13%. Abandoned after two rounds — no institutional infrastructure to sustain it. Mexico City's Hoy No Circula programme, introduced in 1989, led residents to buy second cars to circumvent the restrictions. The programme remained in place thirty-five years later, accomplishing nothing except proving that a policy without adaptive management becomes a monument to its own failure.
Italy's working-age population is projected to decline by 7.7 million by 2050 according to ISTAT — meaning every system built today must be designed to survive demographic transformation, not just the current political cycle.
The pattern of forgetting follows the same arc everywhere. Year 1: crisis identified, budget allocated, optimism. Year 3: results visible, awards, the team starts thinking about the next problem. Year 5: the crisis fades from public memory, budget pressure from newer priorities, the person who wrote the original plan moves to a different department. Year 8: a new administration arrives, the improvement is invisible because it succeeded — clean air is not a headline, only dirty air is. Year 10: the problem returns. A new plan is written. It correctly diagnoses the problem. The filing cabinet opens, and the new plan slides in beside the old ones.
The method works. The evidence is there. What is usually missing is the discipline to apply all five phases, in order, without skipping the uncomfortable ones — and the architecture to ensure that what works today is still working when no one remembers why it was built.
I wrote a book about this. It uses one city — Modena — as the investigation, and a corgi from outer space as the narrator. Every character is fictional. Every number is real. It is called Statistics Don't Cough: Six Problems, One City, One Corgi.
The cheapest thing a city can do is forget. Which is why the last chapter is not an ending. It is the only part that matters.
This is the final article in a series of six exploring the patterns behind Statistics Don't Cough: Six Problems, One City, One Corgi — a book about why intelligent, well-intentioned people get complex problems wrong, and what structured thinking looks like when it's done right. Available now on Amazon.
The Same Root, Five Times
An engineer could draw the solution in an hour. She spent twelve years and 127 emails trying to get five institutions to approve it. The canal flooded three more times while the emails accumulated.
When every root cause analysis terminates at the same point, you are either looking at a methodological artefact or a structural truth. In Modena, it was a structural truth.
DMAIC's third phase — Analyse — uses tools like the fishbone diagram to trace a problem back to its root cause. You start with the visible effect and ask "why" until you reach the structural origin.
In Modena, across five different problem domains — air quality, traffic, waste, housing, and public safety — every fishbone analysis ended at the same place: no institution had the mandate to optimise the whole system. Each department optimised its piece. The pieces did not add up. The gaps between them were where the damage lived.
The traffic system was fragmented across four departments. The health system across constitutional boundaries. The waste system between operator and regulator. The safety system split between three police forces with no integrated analysis. The water system required five institutions to approve a canal redesign — an engineer who could draw the solution in an hour spent twelve years and 127 emails trying to get it built.
Is that a finding about Modena, or is it a feature of the analytical method? If you use a tool designed to find root causes, perhaps it always finds one — and perhaps "governance fragmentation" is just a conveniently abstract place to stop drilling.
So you test it. If governance fragmentation is the real root cause, then cities that reduced it should show measurably better outcomes.
Copenhagen consolidated cycling, transit, and urban planning under a single mobility authority. Its car mode share dropped from 33% to 25% in fifteen years while Modena's held at 63%. Vienna integrated housing, vacancy activation, and social infrastructure under one entity. Its vacancy rate sits below 2%. Ljubljana merged waste collection, processing, and circular economy functions into a single municipal company. It went from landfilling 80% to landfilling less than 5% in a decade.
The convergence is not a methodological artefact. It is an empirical regularity — the same one that systems theorists from Donella Meadows to Elinor Ostrom identified: when complex problems span multiple institutional jurisdictions, fragmentation is not incidental to the failure. It is the failure.
But honest analysis requires a further step. The method tells you what is broken and how to fix it. It does not tell you who benefits from the breaking. That canal did not go unrepaired for twelve years because no one understood hydraulics. It went unrepaired because the institutional architecture distributed responsibility so finely that no single actor bore the cost of inaction — and because the flooding costs fell on a foreign-born tenant in a ground-floor apartment who does not vote in local elections, while the repair costs fell on budgets controlled by people who have never seen his kitchen after it rains.
The engineer said it plainly: "Your fishbone diagram will tell you the root cause is governance fragmentation. It is. But governance stays fragmented because fragmentation protects the people who don't pay the price."
One meeting in one room resolved what 127 emails could not: a shared diagnosis, a joint timeline, a provisional funding agreement — in ninety minutes. The method works. But the fifth discipline is this: follow the root cause even when it leads somewhere uncomfortable. The deepest dysfunction in a system is rarely technical. It is the question of who bears the cost and who controls the repair — and what happens when those are not the same people.
This is the fifth in a series of six articles exploring the patterns behind Statistics Don't Cough: Six Problems, One City, One Corgi — a book about why intelligent, well-intentioned people get complex problems wrong, and what structured thinking looks like when it's done right. Available now on Amazon.
Fear Is More Expensive Than Crime
Modena's homicide rate is lower than Finland's. A shop owner loses seven to eleven times more revenue to fear than she lost to the robbery itself. The gap between perception and data has a price tag.
In Modena, the homicide rate is lower than Finland's. The fear rate is not.
Modena province recorded approximately 30,000 reported crimes in 2023, according to the Interior Ministry data published by Il Sole 24 Ore. The homicide rate: 0.6 per 100,000 — lower than Finland (1.6), Belgium (1.7), or France (1.3). Seventy-one per cent of all reported crime involved no physical contact whatsoever.
By any statistical measure, Modena is a safe city. By any perceptual measure, it does not feel like one. Only 57% of provincial residents felt safe walking alone after dark, according to ISTAT well-being data. A significant share believed serious crime had increased, when in reality it had decreased.
This gap between perception and measurement has a cost, and the cost is not abstract. Consider a shop owner who has been robbed twice in three years — total losses approximately €2,000. She starts closing ninety minutes early because the street feels unsafe after dark. At €35–50 per hour in average revenue, over roughly 300 operating days per year, the early closure costs her €15,000–22,000 annually. The fear costs seven to eleven times more than the crime.
This is what happens when perception drives behaviour instead of data. The shop owner is not irrational. The street has poor lighting — designed for vehicles, not pedestrians. There are fewer people walking after seven because planning zoning concentrated offices instead of mixed-use, so the streets empty at closing time. The environmental signals — the empty pavement, the dark corners, the shuttered shops — manufacture a sense of danger that the crime statistics do not support. And each shop that closes early makes the street emptier, which makes it feel less safe, which makes the next shop close earlier. The fear compounds itself.
No single institution is responsible for the integrated safety of a walk home. Lighting: infrastructure department. Zoning: planning. Policing: three separate forces with no integrated analysis. Commercial activation: chamber of commerce. Each does its part. No one does the whole.
The pattern extends beyond commerce. Social isolation — driven partly by fear of public space — increases mortality risk by 26–32%, according to Holt-Lunstad's meta-analysis in Perspectives on Psychological Science. The US Surgeon General's 2023 advisory equated the health impact of chronic isolation to smoking fifteen cigarettes a day.
Meanwhile, the 2003 European heatwave killed approximately 20,000 people in Italy. A hip fracture from a fall — often connected to social isolation in elderly populations — costs the Italian health system approximately €28,000 per case, with a 25% one-year mortality rate. These are the invisible risks. They do not make the evening news. They do not trigger the alarm systems that evolution built for visible, immediate threats.
And the most damaging crimes of all are the least visible. Domestic violence in the province is estimated at 3,000–4,500 actual episodes against just 450 reported. For every woman who walks into a police station, eight to nine do not. Organised crime generates an estimated €20 billion in turnover across Emilia-Romagna. The public fears the purse-snatcher. The purse-snatcher costs hundreds. The mafia costs billions. The city organises candlelight vigils after the dramatic crime and nothing after the structural one.
Evolution prepared us for the savannah — a threat-detection system capable of sensing a predator's gaze at forty metres. Then we built cities where the leading causes of harm are particulate matter, institutional fragmentation, and isolation. None of which trigger so much as an elevated heartbeat. The Mirage is not a personal failing. It is a mismatch between the risks our biology was built to detect and the risks our systems actually produce.
—
This is the fourth in a series of six articles exploring the patterns behind Statistics Don't Cough: Six Problems, One City, One Corgi — a book about why intelligent, well-intentioned people get complex problems wrong, and what structured thinking looks like when it's done right. Available now on Amazon.
The Price Tag Lies
A woman pays €550 rent on the periphery. Add the car, the fuel, the time — her real housing cost is €855. The rent was one number. The system cost was invisible.
When you look at a single number — the rent, the tax bill, the recycling rate — you are almost certainly looking at the wrong number.
A woman in Modena pays €550 per month for an apartment on the periphery. Affordable, compared to the centre. But she also pays €175 for the car she needs because there is no bus, €80 for fuel, and the equivalent of €50 in time she spends commuting. Her real housing cost is €855 — 51.5% of her gross income. The rent was the single number. The system cost was invisible.
This is a pattern. It operates everywhere single metrics are used to evaluate complex systems.
Modena's recycling rate is 78.9%, according to ISPRA's 2025 report. An excellent number. Treviso, designated European Green Capital 2025, reaches 87.2%. But the recycling rate measures what goes into the sorting stream, not what comes out. The plastic capture rate shows 58%, but the true material recovery rate for plastics is approximately 23%, once sorting losses and non-recyclable fractions are accounted for. Waste composition analyses consistently show that 70–85% of what people put in the general waste bin is recoverable material that never reaches the recycling stream at all.
The waste tax — TARI — is approximately €310 per household per year. It does not change based on how much waste you produce. The person who carefully separates everything pays the same as the person who throws everything in the general bin. The single number — the tax — hides the incentive structure entirely.
The economics of the waste hierarchy are straightforward arithmetic. Landfilling costs €120 per tonne and recovers nothing — while destroying €85 in recoverable material. Recycling costs €65 and recovers €85 — a net profit of €20 per tonne. Prevention costs €5–15 and saves €150 or more. The city spends the most on what works least, and the least on what works most. But these costs fall on different budgets, different departments, and different years — so no one totals them.
Consider energy. More than 50% of Italian residential buildings are classified in energy performance classes F or G, according to ENEA. In Modena, 72% of residential buildings were constructed before 1976 — the year Italy introduced its first energy performance standard. A pre-1976 apartment costs roughly €180 per month to heat. Retrofitted, it costs €60. The rent is the single number. The energy bill is the hidden cost that makes the cheap apartment expensive.
Consider housing supply. Modena has a shortage of approximately 1,800 units. Simultaneously, approximately 5,000 apartments sit vacant. The single number — 1,800-unit deficit — suggests the city needs to build. The full picture suggests the opposite: a vacancy activation problem, not a construction problem. And embedded in every new building, a parking mandate of 1.0–1.5 spaces per unit adds €15,000–25,000 to every apartment's price — a subsidy for car dependency hidden inside the housing market.
The Single Number pattern works the same way with people. In Italy, two out of three non-EU workers are employed below their qualification level — a 66.5% overqualification rate, the highest gap in Europe according to Eurostat. The job title is the single number. The credential recognition system — four institutions, two to three years, €2,000–3,000 — is the hidden structure that produces it. A nurse trained in West Africa cleans offices in a city with thousands of unfilled nursing positions, and the system that keeps her there is invisible to anyone who looks only at the employment statistics.
DMAIC insists on measuring the whole system, not the convenient metric. A single measurement of a complex situation is like a single photograph of a three-dimensional object: accurate from one angle, misleading about everything behind it. The number isn't wrong. It's radically incomplete. And decisions based on radically incomplete numbers produce outcomes that reliably surprise the people who made them — then surprise them again, identically, the following year.
This is the third in a series of six articles exploring the patterns behind Statistics Don't Cough: Six Problems, One City, One Corgi — a book about why intelligent, well-intentioned people get complex problems wrong, and what structured thinking looks like when it's done right. Available now on Amazon.
The Numbers Nobody Counts
During COVID, Italy's traffic dropped 75%. Air pollution fell less than 10%. The visible suspect wasn't the killer — and 43,000 people die every year from what is.
Italy has the highest air-pollution death toll in Europe. The political attention it receives is close to zero.
The European Environment Agency published its figures in December 2025: 43,083 premature deaths in Italy attributable to PM2.5 exposure in a single year. The highest absolute figure among all EU member states.
For context: that is more than all road traffic deaths, workplace fatalities, and homicides in Italy combined — by a wide margin.
In Modena, the monitoring station on Via Giardini records PM2.5 at an annual mean of 23.7 µg/m³. The EU limit is 25. The WHO guideline is 5. Modena is legally compliant and nearly five times over the safety threshold recommended by the world's leading health authority.
Here is what makes this invisible. PM10 — the coarser particle fraction — has been declining: from 42.1 µg/m³ in 2015 to 38.2 in 2024. Progress. At that rate of 0.4 µg/m³ per year, Modena will reach the WHO guideline of 15 µg/m³ in approximately 2082. Nearly sixty years away.
The cost is not hypothetical. But no line item in the municipal budget says "air pollution." The cost is distributed across hospital beds, prescriptions, sick days, and early retirements — buried in health spending that no one connects to the air outside the window.
COVID provided an accidental experiment. During lockdown, traffic in Italy dropped 60–82% according to Google Mobility Reports and ANAS motorway data. In Modena, PM10 fell from 38.2 to approximately 35.1 µg/m³ — less than a 10% drop. Traffic nearly disappeared, and the air barely changed.
Why? Because traffic is not the main source. According to PREPAIR project emission inventories and ARPAE source apportionment studies, heating accounts for roughly 39% of particulate matter in the Po Valley, traffic for 34%, and agriculture for 24%. During winter pollution episodes, secondary formation — chemical reactions in the atmosphere where ammonia from livestock and fertiliser production combines with nitrogen oxides — can account for 50–70% of total PM mass.
The city debates traffic because traffic is visible. The air kills quietly, distributed across four source sectors and a chemistry set that no one voted for. DMAIC's second phase is Measure — and measurement means counting what matters, not what is easy to count.
If a hundred people died in a building collapse, the nation would stop. If a hundred people died in a flood, there would be a day of mourning. If a hundred people were killed by a contaminated product, the manufacturer would be in prison. But a hundred people killed by the air itself — slowly, invisibly, one compromised lung at a time — produce nothing. No emergency. No inquiry. No memorial. Just the next annual report, with a number that is slightly different and equally ignored.
The numbers exist. ARPAE collects them. The gap is not knowledge. It is attention — and attention follows visibility, not severity. That is the pattern. It is not unique to air quality, and it is not unique to Modena. It operates wherever the most dangerous problem is the one you cannot see, smell, or blame on a single villain.
This is the second in a series of six articles exploring the patterns behind Statistics Don't Cough: Six Problems, One City, One Corgi — a book about why intelligent, well-intentioned people get complex problems wrong, and what structured thinking looks like when it's done right. Available now on Amazon.
Define Before You Solve
Modena has 160,000 cars and 247 km of bike lanes. A bicycle completes a typical urban trip 36% faster than a car. So why does the city keep widening roads?
The most common mistake in problem-solving is not getting the answer wrong. It is answering the wrong question.
In quality management, there is a discipline called DMAIC — Define, Measure, Analyse, Improve, Control. It was developed for manufacturing, where it eliminated defects on production lines. The first phase is Define: establish what the actual problem is before you touch anything.
It sounds obvious. It is almost never done.
Modena, Italy — 185,000 people, in the Po Valley — has a traffic problem that everyone can see. Car mode share sits at 63%, according to the city's own sustainable mobility plan. There are 160,000 registered motor vehicles, roughly one per resident including infants. Commuters spend over 200 hours per year driving and around €5,700 on car ownership. A fit cyclist completes a typical urban trip in 36% less time than a car.
The instinct is to fix the traffic. Build a bypass. Widen the road. Add capacity.
But transport economists have known since 1962 that adding road capacity generates new demand. Anthony Downs described the phenomenon in Traffic Quarterly that year. Duranton and Turner confirmed it empirically in the American Economic Review in 2011: new highway capacity fills within one to five years. The solution reproduces the problem.
This is what happens when you skip the Define phase. You see congestion and reach for the road. You see the symptom and treat it. You solve what is visible rather than what is causal.
When you actually define the problem — when you follow the data instead of the complaint — you find that the real cost is not the traffic itself but the system that produces it. Modena has 120,000 parking spaces. The implicit annual subsidy for that free parking is approximately €41.8 million, calculated using the methodology in Donald Shoup's The High Cost of Free Parking. Every new housing unit is required by law to include 1.0–1.5 parking spaces, adding €15,000–25,000 to every apartment's price. The city builds car dependency into its physical structure, then wonders why 63% of trips happen by car.
Stockholm understood this. When it introduced congestion pricing in 2006, traffic in the metropolitan area dropped 20–22%, according to Jonas Eliasson's research in Transportation Research Part A. CO₂ emissions fell 2–3%. Not because they built more roads. Because they redefined the problem: not insufficient capacity, but underpriced demand.
Meanwhile, nearly one-third of Modena's residents — 54,500 people — cannot drive at all, due to age, disability, economics, or legal status. They depend entirely on a system designed around a mode they cannot use. The bus rider sits in the same traffic as the car, penalised for making the socially optimal choice. The driver is rewarded for making the socially destructive one. The incentive structure is precisely backwards — and invisible, because the question was defined as "how do we move vehicles?" rather than "how do we move people?"
Modena has widened roads six times since 1962. Each time, congestion returned within eighteen months. Six repetitions of the same intervention producing the same failure is not bad luck. It is a system performing exactly as designed — for the wrong objective.
The first discipline is the one most consistently skipped. Not because it is difficult, but because the wrong question feels so obviously right that no one thinks to ask whether it is.
This is the first in a series of six articles exploring the patterns behind Statistics Don't Cough: Six Problems, One City, One Corgi — a book about why intelligent, well-intentioned people get complex problems wrong, and what structured thinking looks like when it's done right. Available now on Amazon.